
Public SaaS is Overvalued Heading Into 2024
An assessment of prevailing multiples in the current environment

Programming note: Apologies for the pause in Growth Mindset posts over the past two months. With full-time recruiting, finals, and the holidays in quick succession I needed to prioritize my time, but am now excited to get back to a regular posting schedule. Thank you for sticking with me!
Current multiples

If you were to look at this chart of average TEV / Revenue multiples for Public SaaS companies in the US1, you might conclude that SaaS valuations are “back to normal” after becoming “detached from reality” during COVID. In fact, average Public SaaS revenue multiples sit at 10.1x today, which is exactly equal to their Pre-COVID average from Nov. 2013 – Feb. 2020. Thank goodness, right? Now we can all finally move on from COVID-induced volatility!
Not so fast… despite the shape of this graph I would argue Public SaaS businesses are still meaningfully overvalued (at least relative to historicals) heading into 2024. Let’s dive in to find out why:
What’s in a multiple?
Anyone who has ever built a DCF knows that in order to calculate the value of a company you project out its cashflows for a certain period (say 10 years), add on a terminal value to account for future unprojected cash flows (years 11 through infinity), and discount everything back to the present day. The formula for that terminal value calculation is TV = FCF * (1 / (r-g)), where r is your discount rate and g is the projected cashflow growth rate. Because (1 / (r-g)) is multiplied by FCF to get to the terminal value, it can be thought of as a FCF multiple. Thus, any DCF valuation has just two basic components:
The projected 10 years of cashflows
The terminal value, which is really just a multiple * FCF in Year 11
Whenever someone uses multiples instead of a DCF to value a business, all they’re really doing is skipping the first bullet point and applying that terminal value formula to the business where it sits today vs. in Year 11. If they use a FCF multiple they’re implicitly taking a view on what the right discount rate is (r), and what rate cashflows will grow at (g). If they use a different multiple, say TEV / Revenue, they’re also taking a view on what % of the chosen metric (in this case revenue) will convert into FCF. This is because ultimately cashflows are what deliver value in any business.
Thus, even if it’s not explicit, there are always three basic assumptions embedded in any multiple:
The portion of the chosen metric that turns into FCF (if you’re using a FCF multiple, this assumption = 1)
The discount rate, r
The FCF growth rate, g
Highlighting the assumptions baked into a multiple
We can now look at any multiple and attempt to “back out” what it’s implying about FCF conversion, r, and g. If we assume for simplicity FCF conversion is equal to current FCF margin, and that plugging the prevailing 10-year treasury yield into the CAPM2 generates a reliable discount rate, then we can zero in on what a multiple implies about g specifically. Let’s take a look at implied g over the past decade:
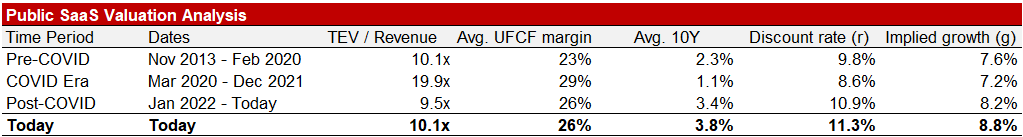
We see that with an average discount rate of 9.8% and UFCF margins at 23% for the Pre-COVID era, the 10.1x TEV / Revenue trading multiple implied 7.6% terminal growth for the cohort. This implied g actually decreased to 7.2% during COVID because even though the revenue multiple almost doubled to 19.9x, the 10-year yield was cut by more than half and UFCF margins slightly improved. What’s interesting about today is with a 3.8% 10-year driving an 11.3% discount rate and relatively consistent UFCF margins, we need to believe an 8.8% terminal growth rate for the 10.1x revenue multiple to make sense. The big question is, do we?
Finding g
I would say it’s unlikely future growth for Public SaaS businesses will be significantly higher than in years past3, which means 8.8% is probably too high. Our task, then, is to determine what we think the right g is. Fortunately public companies give guidance for what they expect their revenues to grow at over the next year, so we can at least use that as a reference point. If we compare the implied g from above to average 1-year growth guidance, we can get a sense of how conservative / aggressive the market is in underwriting the persistence of that growth long term:

What we see from this data is Pre-COVID and during COVID the markets actually applied the same multiple of 1-year guidance – 0.32x – to derive g. Today, however, that multiplier has essentially doubled to 0.62x. Said plainly, that means the markets are being twice as aggressive in their growth persistence assumptions as they have been in the past. To me, that feels too aggressive.
If we thought the consistent 0.32x from the past was the right persistence multiplier, then we could plug a new implied g into our analysis and derive a new implied TEV / Revenue multiple. Doing this yields the following:
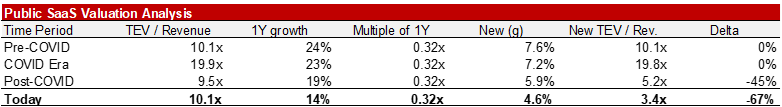
Wow! Holding everything else constant our new g of 4.6% implies current TEV / Revenue multiples should be at 3.4x, which is 67% lower than where they are today! This seems crazy! Is the Public SaaS market really poised for a 67% crash%?
Making realistic assumptions
I don’t think so. The 14% 1-year growth guidance likely incorporates a 2024 recession in many companies’ forecasts, so that’s not an apples-to-apples comparison to the Pre-2022 growth run. Additionally, multiples are supposed to incorporate FUTURE expectations, so fixing the 10-year yield at today’s 3.8% feels overly punitive. If we make some reasonable assumptions about long-term FCF conversion, r and g then the picture becomes a little more palatable:

Here we see that reasonable forward-looking assumptions (30% FCF margin, 3.0% 10-year yield, and 20% near-term growth) imply Public SaaS companies should be trading at 7.3x revenues. Given where multiples are at today, this means we would need prices to fall by an additional 28% before I would be ready to call Public SaaS “fairly valued.” While 28% is a far cry from the 67% we saw earlier, it still paints a very different picture than the original chart we started this post with!
Three big takeaways:
We can’t look at multiples in a vacuum. Despite what our original chart showed, you could argue Public SaaS multiples still need to come down 20-30% to be considered fairly valued. This is because multiples factor in FCF conversion, discount rates, and growth assumptions – and when those variables change so should “fair” multiples.
Interest rates matter SO much. I know I certainly thought the eye-watering multiples we saw during COVID were driven by overly optimistic growth assumptions, but this analysis would suggest implied growth assumptions for Public SaaS companies actually came DOWN during that time. Rather, it was the drop in interest rates that buoyed multiples. In some ways this means the biggest mistake we all made back in 2021 was assuming capital would be free forever. This highlights just how important having a sober view on long-term interest rates and the cost of capital is when valuing a business.
Something must be wrong. Clearly, either software assets are materially over-priced heading into 2024, or one (or more) of my assumptions is wrong. If we take the view that prevailing valuations reflect intrinsic value, I would bet it’s because I’m wrong about FCF margin. I assumed 30% FCF margin (which is higher than historical average!) because I’m giving these businesses credit for margin expansion as they scale, but you could make the argument that as new AI solutions cheaply replace significant swathes of knowledge work we’ll see software businesses meaningfully cut labor expenses, which will drive further improved FCF margin. Looking at current multiples I have to think this AI-driven margin improvement is at least implicitly baked into many prevailing prices.
Notes:
The Public SaaS cohort is based on the 91 companies listed on Meritech Capital’s Public SaaS Comparables Table. Data pulled from CapIQ.
The Capital Asset Pricing Model (CAPM) is the leading method used to calculate the cost of equity for companies. Learn more here. For context, I used a 1.5 beta for SaaS companies and assumed 100% equity financing as simplifying assumptions in this post.
With the exception of Klaviyo, it’s been almost two years since we’ve seen a SaaS business IPO. This means the current cohort of Public SaaS businesses is much older than in years past, and so definitionally we would expect them to grow more slowly. Add in factors such as the maturation of cloud and the impact of higher interest rates on capital allocation decisions, and it seems highly unlikely future SaaS growth will outpace the past for this cohort.
Disclaimers: While I’m arguing that in aggregate Public SaaS businesses are overvalued compared to their historical norm, I want to make two things clear:
This doesn’t mean every Public SaaS business is overvalued. There are undoubtedly still great individual buys at current prices.
This doesn’t mean I’m predicting a correction. I’m using the pre-COVID era as my base of “normal” valuations, but maybe that’s not the right baseline. And even if it is, the markets can stay “irrational” for a very long time. This post is purely a thought experiment for learning purposes only, not investment advice in any way.